
- Overview
- Blood Glucose Levels and HbA1c
- Lesions of Non-Proliferative Diabetic Retinopathy
- Lesions of Proliferative Diabetic Retinopathy
- Macular Oedema
- Retinal Ischaemia
- Diabetes and Primary Open Angle Glaucoma
- Related Topics
- Differential Diagnosis
- References
Overview
The World Health Organisation definition of diabetes is as follows: "A metabolic disorder of multiple aetiologies characterised by chronic hyperglycaemia with disturbances of carbohydrate, fat and protein metabolism resulting from defects in insulin secretion, action or both".
Symptoms of undiagnosed diabetes mellitus may include excessive thirst and urination, blurred vision, unexplained weight loss, lethargy, poor wound healing, increased hunger and numb or tingling hands or feet. Poorly controlled diabetes can lead to numerous complications over time including cardiovascular disease, neuropathy, nephropathy, hearing impairment, skin infections, Alzheimer's disease, depression and, of course, diabetic retinopathy.
Retinal examination allows direct visualisation of the vasculature, a situation unable to be replicated anywhere else in the body. In this way we are able to view subtle vascular changes resulting from diabetes before signs and symptoms appear elsewhere in the body. Retinal examination can also provide insight into the level of vascular damage likely present elsewhere in the body.
Type 1 diabetes typically has an early onset and makes up about 10% of cases. It is thought to occur in genetically predisposed individuals, with a trigger event (such as a virus) causing an immune response that leads to the destruction of insulin producing Beta-cells.
Type 2 diabetes makes up the majority of cases and is associated with numerous risk factors, including family history, age, ethnicity, people who are overweight, obese or physically inactive, hypertension, a history of gestational diabetes and high triglycerides or low HDL. Approximately 15% of type 2 diabetes is genetic.
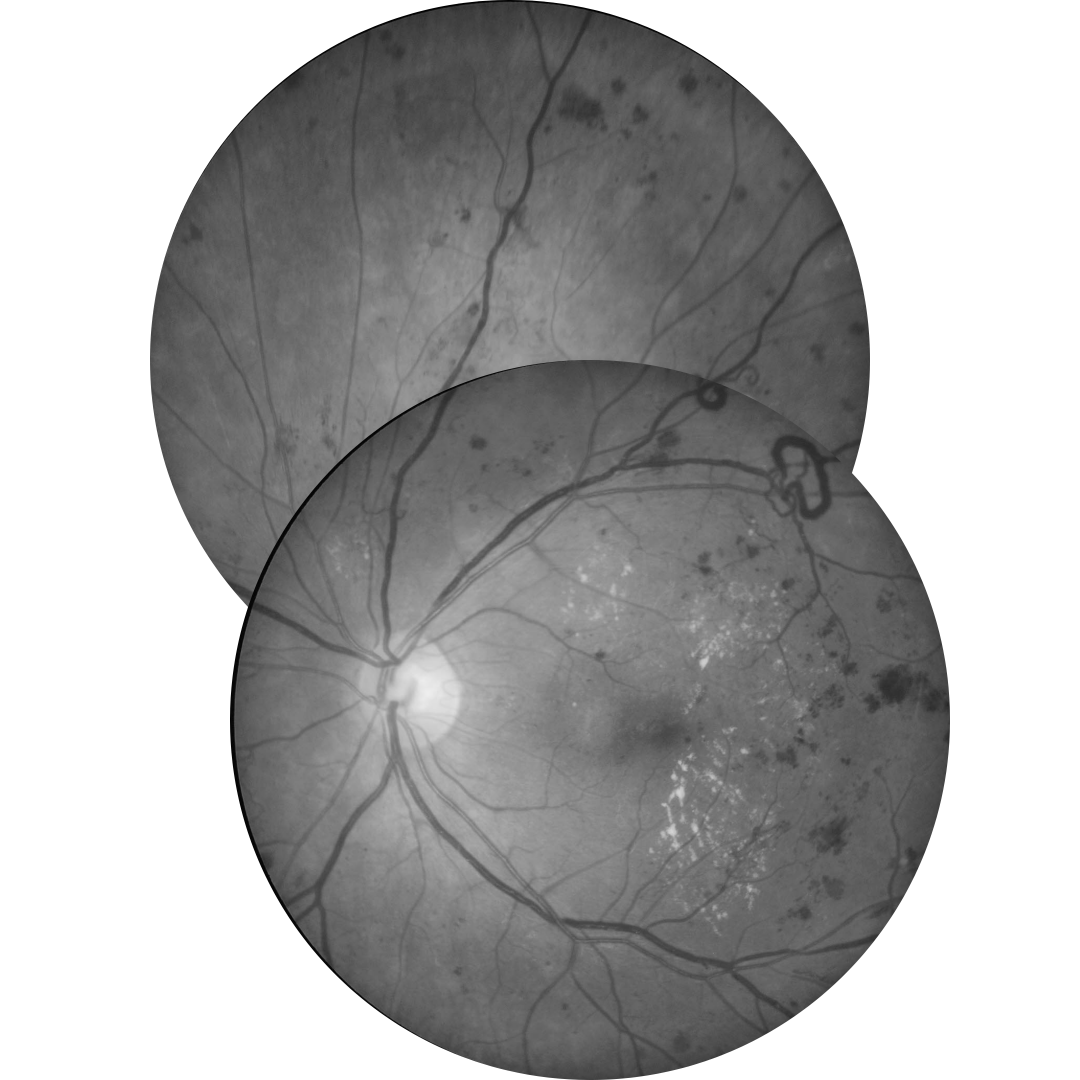
Below is a summary and examples of different lesions associated with diabetic retinopathy.
Blood Glucose Levels and HbA1c
Blood tests are used to test for diabetes and to monitor glucose control in those people with diagnosed diabetes. There are two tests commonly used:
1. Blood glucose levels: This gives an indication of the amount of glucose present in the blood at a certain point in time. Diabetes is suspected if the fasting blood glucose level is 7.0 mmol/L (126 mg/dl) or higher.
2. Glycosylated haemoglobin A1c test (HbA1c): This is a measure of the percentage of blood glucose that is attached to haemoglobin. It is a good indicator of longer term glucose control as haemoglobin will remain glycosylated for 2-3 months before degrading. As a result this measurement gives an indication of average glucose control over that same period. A HbA1c of 7% or higher is an indication of diabetes.
It is important when taking medical history for a patient with diabetes that the HbA1c is recorded to help gauge the patient's long-term control of their blood glucose.
Lesions of Non-Proliferative Diabetic Retinopathy
-
Microaneurysms
Microaneurysms are the earliest clinical sign of DR. They are outpouchings of the capillary wall, due to pericyte loss, which can rupture and leak leading to intraretinal haemorrhage, oedema or hard exudate.
Clinically, they appear as isolated, round red dots of varying size which can resolve spontaneously. They may be undetectable on OCT or, if visible, typically appear as small round or oval lesions, originating from either the superficial or deep capillary plexi , fully or partially capsulated in 56% of cases.
On OCT angiography they may be seen as a small area of hyper-reflectivity adjacent to a blood vessel within the inner retinal layers.
-
Dot and blot haemorrhages
Dot and blot haemorrhages are usually caused by a ruptured or leaking microaneurysm or retinal capillary, typically within the inner nuclear layer (INL) or outer plexiform layer (OPL).
Dot haemorrhages lie deeper in the retina than blot haemorrhages and can be difficult to distinguish from microaneurysms. Dot/blot haemorrhages take longer to resolve than more superficial flame-shaped haemorrhages.
They may be undetectable on OCT or present as an area of hyper-reflectivity.
Dot/blot haemorrhages can also occur in other conditions which occur more frequently in patients with diabetes, such as hypertensive retinopathy, retinal vein occlusion and ocular ischaemic syndrome.
-
Flame-shaped haemorrhages
Flame-shaped haemorrhages take on their characteristic shape due to their location in the retinal nerve fibre layer.
-
Cotton wool spot
Cotton wool spots result arise from retinal ischaemia in diabetic retinopathy, however other factors responsible for focal disruption of axoplasmic flow in the retinal nerve fibre layer may result in a similar presentation.
They appear as slightly elevated, yellow-white or grey-white, cloud-like lesions, are typically found in the posterior pole and less than 1/3 disc diameter in size.
OCT imaging shows an elevated, hyper-reflective lesion in the retinal nerve fibre layer (RNFL) which may distort the underlying retinal layers.
Differential diagnoses include ischaemic, immune, infectious or inflammatory conditions as well as embolic, neoplastic, medication, traumatic, idiopathic and other miscellaneous causes.
They may resolve in 6-12 weeks but can persist longer in DR.
-
Venous beading
Venous beading is a venous calibre irregularity which occurs in areas of severe retinal hypoxia. A sausage-link appearance occurs in severe cases. Other vascular remodelling occurs in diabetic retinopathy such as dilation, reduplication and loops.
-
Intraretinal microvascular anomalies (IRMA)
Intraretinal microvascular abnormalities (IRMA) are abnormal intraretinal shunts which appear as branching or dilation of capillaries within the retina in areas of poor retinal perfusion. They have a similar appearance to NV but with slightly larger vessel calibre. They are a precursor to NV which may form in close proximity.
Lesions of Proliferative Diabetic Retinopathy
-
Retinal neovascularisation
Neovascularisation (NV) appears as new vessels which loop back around or form a disorganised network above the retinal surface, distinguishing them from normal capillaries.
They are found on the surface of the internal limiting membrane (ILM) or posterior hyaloid face of the vitreous and occur at the border between perfused and ischaemic retina.
They are prone to bleeding, resulting in pre-retinal (PRH) or vitreous haemorrhage (VH). Any pre-retinal or vitreous haemorrhage should be considered as NV until proven otherwise.
Dynamic interaction between NV and the vitreous can lead to an inflammatory response and
subsequent fibrous proliferation (FP).Neovascularisation of the disc (NVD) describes new vessels on or within 1 disc diameter of the disc as opposed to neovascularisation elsewhere (NVE) outside this region.
-
Pre-Retinal Haemorrhage
Pre-retinal haemorrhage occurs when new vessels break and bleed in the pre-retinal space, obscuring the underlying retinal detail. This may occur when the neovascularisation proliferates along the posterior surface of the relatively mobile vitreous, causing traction on the weak new vessels, particularly where there is a strong adherence between the vitreous and the retina at the area of neovascularisation or fibrovascular proliferation.
Pre-retinal haemorrhage may present as a D-shaped or boat-shaped haemorrhage trapped between the inner limiting membrane (ILM) and the posterior hyaloid face of the vitreous, although they may also appear linear, blot-like or arcuate.
-
Vitreous Haemorrhage
Vitreous haemorrhage occurs when weak new vessels bleed and the blood enters the vitreous instead of being trapped in the pre-retinal space.
These haemorrhages will appear as a reddish or greyish area of haze obscuring the underlying retinal detail. OCT may assist in identifying the location of the haemorrhage (which appears hyper-reflective).
-
Tractional Retinal Detachment
Retinal folds, traction, or tractional retinal detachment (TRD) can occur if the vitreous is adherent to the retina in an area of fibrovascular scar formation. These changes are more likely to occur along the major
vascular arcades.TRDs are concave and usually progress slowly, however a hole can form in the detached retina leading
to a combined TRD and rhegmatogenous retinal detachment.Clinically, TRD will be associated with neovascularisation and fibrovascular proliferation and appear elevated.
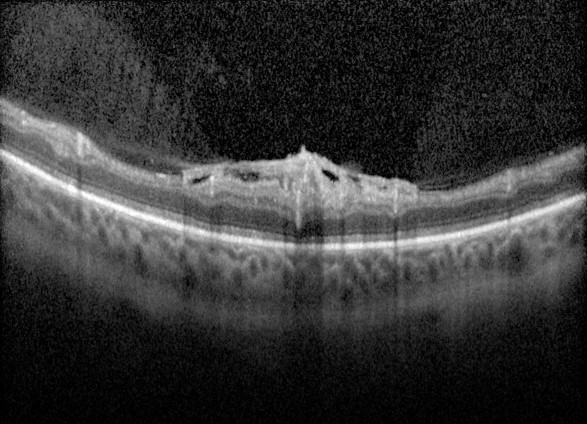
Macular Oedema
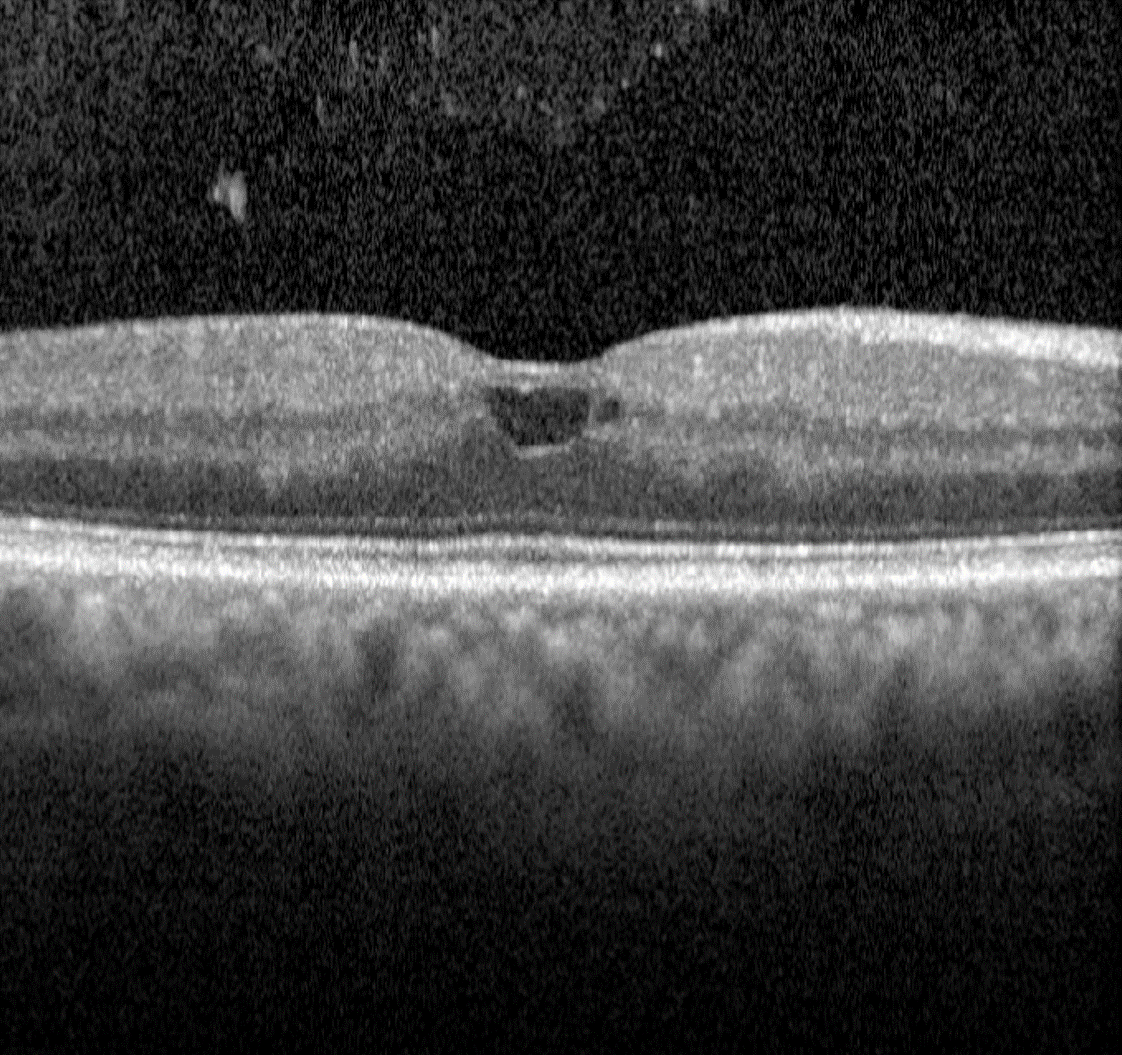
In diabetic retinopathy, macular oedema results from increased vascular permeability and a breakdown of the blood retinal barrier. These pathological processes cause leakage of lipids, proteins and serous fluid into the retina or subretinal space.
Clinical signs of macular include hard exudates and/or intraretinal oedema.
Hard exudates are discrete, yellow-white lipid deposits that may be isolated, diffuse, circinate (circular), or star-shaped. With OCT, they appear as intraretinal hyper-reflective deposits, usually in the outer plexiform layer (OPL) or outer nuclear layer (ONL). The presence of hard exudates may indicate either past or present macular oedema.
Intraretinal oedema may be appreciated clinically as retinal thickening, however can be missed in the early stages. OCT imaging may show either diffuse thickening or discrete intraretinal cystic spaces. Macular oedema may present in the absence of hard exudates, making it difficult to detect during a clinical examination or on fundus photography. For this reason, macular OCT scans are highly recommended for patients with a medical history of diabetes, particularly when other signs of diabetic retinopathy are present, macular oedema is suspected, or visual acuity is reduced.
It is important to note that hard exudates and intraretinal oedema may also be associated with other conditions, such as hypertensive retinopathy, retinal arterial macroaneurysm, Coats disease and choroidal neovascularisation.
Retinal Ischaemia
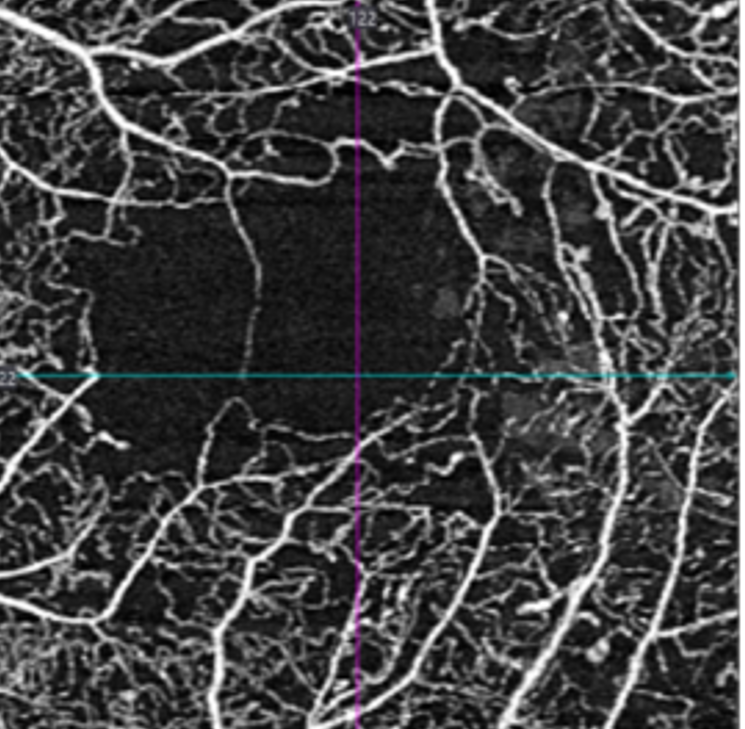
In patients with diabetes, retinal ischaemia can occur at any location due to capillary drop-out causing areas of reduced perfusion. If this occurs at the macula it can significantly impact vision.
It is not possible to accurately identify macular ischaemia with funduscopy. Previously, macular ischaemia could only be identified with fluorescein angiography, however the evolution of OCT angiography now allows practitioners to visualise the retinal vasculature and identify areas of non-perfusion and capillary drop-out.
OCTA does not require the injection of fluorescein dye and works by detecting the movement of erythrocytes through the retinal and choroidal vasculature. Small changes in the vessels are detected through rapidly repeated measurements and interpreted as flow. This data is then used to create a three-dimensional image of the retinal and choroidal vessels.
Diabetes and Primary Open Angle Glaucoma
A 2024 paper by Chauhan et al. explored the association between diabetic retinopathy (DR) and primary open angle glaucoma (POAG). The authors found that once they accounted for age, sex, ethnicity, insulin status, HbA1c and medical history, there was a heightened risk for development of DR at 10 years in patients with POAG. This was true in both types of DM, but the effect was greater in T1DM.
The incidence of DR among patients with POAG at 10 years was 5.45% in patients with diabetes (type 1 or 2), compared with 2.23% in patients without glaucoma.
The risk of PDR was notably greater in both the T1DM and T2DM patients within the POAG group compared to those without - across all time points (1,5 and 10 years).
These results imply that vigilant screening for DR in diabetic patients who also have POAG is necessary to mitigate risk
Differential Diagnosis
References
Alam, M, Zhang, Y, Lim, JI, Chan, R. Yang, M, Yao, X, (2020) Quantative optical coherence tomorgraphy angiography features for objective classification and staging of diabetic retinopathy. Retina: February 2020 - Volume 40 - Issue 2 - p 322-332.
Acón, D, Wu, L, (2018) Multimodal Imaging in Diabetic Macular Edema, Asia-Pacific Journal of Ophthalmology: Volume 7 - Issue 1 - p 22-27.
Chauhan MZ, Elhusseiny AM, Kishor KS, Sanvicente CT, Ali AA, Sallam AB, Bhattacharya SK, Uwaydat SH, (2024) Association of Primary Open-Angle Glaucoma with Diabetic Retinopathy among Patients with Type 1 and Type 2 Diabetes: A Large Global Database Study,
Ophthalmology.
Duh, E. J., Sun, J. K., & Stitt, A. W. (2017). Diabetic retinopathy: current understanding, mechanisms, and treatment strategies. JCI insight, 2(14).
Proposed international clinical diabetic retinopathy and diabetic macular edema disease severity scales. Ophthalmology, Volume 110, Issue 9 - p 1677-1682.
Johannesen, SK., Viken, JN., Vergmann, AS. and Grauslund, J. (2019), Optical coherence tomography angiography and microvascular changes in diabetic retinopathy: a systematic review. Acta Ophthalmol, 97: 7-14.
Tran, K. Pakzad-Vaezi, K (2018) Multimodal imaging of diabetic retinopathy, Current Opinion in Ophthalmology: November - Volume 29 - Issue 6 - p 566-575
Various evidence-based guidelines:
- The Royal College of Ophthalmologists Diabetic retinopathy guidelines December 2012
- The American Academy of Ophthalmology Preferred Practice Pattern - Diabetic Retinopathy
- American optometric Association Evidence-Based Clinical Practice Guideline (2014). Eye Care of the patient with Diabetes mellitus.
- NHMRC Guidelines for the management of diabetic retinopathy.
- RANZCO referral pathway for diabetic retinopathy