
- Overview
- Visual Field Indices
- Field Defects Typical of Glaucoma
- Recent developments in visual field testing using the HFA
- Links to full text
- Related Topics
- References
Overview
There are several static perimeters on the market, each of which utilise different light stimuli and also different testing grids. In terms of recommendations for visual field coverage when assessing glaucoma, the test grids should include test locations that evaluate "retinal nerve fibre layer bundle" defects, including the arcuate region, central visual field and nasal step.
1. Humphrey Field Analyser (HFA)
This is the perimeter used at Centre for Eye Health from which all the images within this resource are obtained. Two test grids that are commonly used for glaucoma are the 24-2 and 10-2, and are available on the HFA. The 24-2 grid has testing points located 6 degrees apart and is a current clinical standard for static perimetry when assessing a patient suspected of having glaucoma. Recently however, there is increased recognition of the importance of central field assessment in glaucoma - in both early and late stage disease - due to the potential functional impact and limitations of field loss close to fixation.
The 10-2 grid is traditionally used for assessment of the central field. Recent studies have shown that 13% of eyes with glaucoma that have a repeatable defect on 10-2 testing do not have one with 24-2 testing. Conversely, 16% of those with a repeatable defect on 24-2 testing do not have a repeatable defect on 10-2 testing. Thus, they are not necessarily interchangeable and should be used in a complementary fashion. Recently Zeiss released a new grid 24-2C that aims to combine the 24-2 and 10-2 grids and the utility of this innovation is reviewed later on this page.
For suspected neurological loss, a 30-2 is the preferred grid as this will capture more peripheral field loss.
2. Medmont Automated Perimeter (M700)
The Medmont perimeter utilises a "Fast Threshold Examination Strategy" where the full threshold is determined for one calibration point in each quadrant. Using an age-related normative database, further testing stimulus levels are derived using a probability algorithm.
For glaucoma assessment, this device has a testing grid "Glaucoma Test" which examines 104 points within the central 22 degrees of the field in three quadrants, extending to 50 degrees nasally, which is a region important in glaucoma. For evaluating central field loss, the "macula" grid examines 49 points within the central 10 degrees of the field. The neurological grid examines 164 points within the central 50 degrees of the field.
3. Octopus 900 Perimeter
The Octopus employs a strategy termed Tendency Oriented Perimetry (TOP) which utilises a bracketing strategy to determine point sensitivities. The fast-testing strategy reduces test time to 2-4 minutes per eye. For glaucoma assessment, the G-program is typically used as this allows testing of the central 30 degrees of field with testing points correlated to a map of the nerve fibre bundles, aiding assessment of structure-function correlation. The M-pattern is used for assessment of central vision loss, allowing analysis of the central 10 degrees of the visual field.
This page will cover the key topics required to interpret and understand visual field printouts in the context of glaucoma. While the images used are from the HFA, much of this information is adaptable to other static perimeters as outlined above.
Visual Field Indices
-
Reliability Indices
The reliability indices are located at the top left of the visual field printout and cut-off points are determined by the manufacturer for determining reliability. It is becoming increasingly recognised that there are limitations to traditional methods of measuring test reliability. This is due to changes to the algorithm that are not necessarily reflective of reliability of the output result. Instead, more recent suggestions are that these metrics should not be used in a binarised pass/fail fashion, but rather in conjunction with careful examination of the visual field test result for other signs of low test reliability.
Excessive high positives and high fixation losses or gaze deviations may be indications to repeat the visual field examination. Cloverleaf defects are indicators of inattention. Refractive scotomata can confound analysis and detection of true pathological defect.s Seeding point errors are also an indication to repeat the test, and further detail around this type or error is available later on this page.
-
Global Indices
Mean deviation represents the "average" of the difference of sensitivity values from the distribution of age-similar normal subjects. It is calculated by the software based on the values found on the deviation map. Mean deviation becomes increasingly negative as there is an increased deviation from normal.
Pattern standard deviation refers to the standard deviation of all differences across the visual field after correction for the patient's hill of vision. As it is a standard deviation, it is always a positive number and it will increase if there is a greater variation in the numbers on the pattern deviation map across the visual field. This number therefore highlights focal loss.
The Glaucoma Hemifield Test (GHT) provides an analysis of asymmetry between the superior and inferior visual fields. This is reported as either "within normal limits", "borderline" or "outside normal limits". If the patient's sensitivity is higher than normal across the visual field, this will be reported as "abnormally high sensitivity", or conversely if there are widespread areas of reduced sensitivity, this is reported as a "generalised reduction in sensitivity".
-
Local Indices
When analysing visual fields, the printouts should be arranged so that the left visual field is on the left side, and the right on the right side as you are looking at them so that this reflects what the patient is actually seeing.
A visual field defect is identified using the "cluster" criterion which specifies that you have 3 or more contiguous (neighbouring) points of p<0.05 (5%) where at least one of these points is p<0.01 (1%). This refers to the pattern deviation map, and the p values are shown in a key at the bottom right of the HFA printout.
Field Defects Typical of Glaucoma
-
Overview
There are several visual field defects typically associated with glaucoma. They are typically described to be "retinal nerve fibre layer bundle" defects. It is important to realise however that these same defects may also be associated with other conditions so cannot be used in isolation to reach a diagnosis of glaucoma. The most common glaucomatous field defects are as follows:
1.Arcuate defect: Field loss extending from the blind spot to the nasal field with at least one point outside 15⁰ nasally and at least one abnormal point temporally
2. Nasal step: Field loss respecting the nasal horizontal midline with at least 1 abnormal point outside 15⁰. No more than 1 point may be on the temporal side.
3. Paracentral defect: : A small visual field abnormality not contiguous to the blind spot and within 15⁰ of fixation, obeying the horizontal midline.
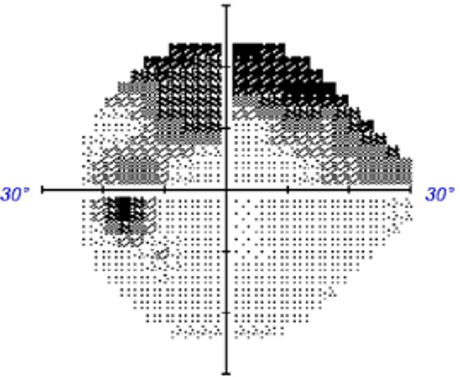
4. Ring scotoma/peripheral constriction: Typically seen in advanced glaucoma and caused by the presence of both superior and an inferior arcuate defects.Rarely, the following defects may also be associated with glaucoma (although other causes are more likely):
1. Centrocaecal defect: Field loss extending from blindspot to fixation. Must include fixation and does not obey horizontal midline. Usually due to damage of the papillomacular bundle.
2. Enlarged blindspot: : Visual field loss involving at least two points contiguous to the blind spot. -
Case 1: Arcuate Defect
A 70 year old Asian male with intraocular pressure of 27mmHg in the left eye in the context of a corneal thicknesses at the lower end of the normal range (510µm). He reports a history of heart disease but reports good health otherwise.
-
Case 2: Nasal Step
A 45 year old Asian female presents with occasional headaches. She reports a family history of glaucoma (mother). This case will focus on her right eye. Her intraocular pressure is 23mmHg in the context of a thicker than average cornea (601µm).
-
Case 3: Paracentral Scotoma
A 45 year old Asian male who reports good general health and no family history of glaucoma. This case will focus on his right eye. His intraocular pressure was 23mmHg in the context of a thin cornea (508µm)
-
Case 4: Peripheral field constriction
A 75 year old Caucasian male who reports good general health and a family history of glaucoma in his mother. This case will focus on his right eye. His intraocular pressure is 19mmHg in the context of average central corneal thickness (558µm).
Recent developments in visual field testing using the HFA
-
This section will review some of the recent updates to testing options in the Humphrey field analyser (HFA) specifically.
-
SITA Faster testing algorithm
The SITA Faster testing algorithm has been shown to be more than 50% faster when compared with SITA Standard whilst also showing similar sensitivity (Heijl et al 2019; Phu et al. 2019). Clinicians should be aware however of the higher rate of false positive rates and seeding point errors using this testing algorithm. The increased rate of false positives is due to changes to the algorithm and are not necessarily reflective of reliability of the output result (as outlined above under the heading "Reliability Indices").
Phu and Kalloniatis (2021) developed a testing strategy to identify seeding point errors early, and thresholds that indicate a re-start of testing should be considered. The key points of this strategy are as follows:
1. Check each seeding point sensitivity result. If these are 26 dB or less, consider re-testing.
2. If the seeding point sensitivity is greater than 26, add up the differences of the 4 neighbouring points. If the sum of the differences is 11dB or greater, consider retesting.If re-testing, the instructions for taking the visual field test should be reiterated.
-
Frontloading Visual Fields
The SITA Faster algorithm has the advantage of reducing testing time, potentially allowing 2 tests per eye to be conducted within 20 minutes at one consultation, similar to the time typically required for conducting 1 SITA-Standard test per eye. Phu and Kalloniatis (Am J Ophthalmol, 2021) introduced and evaluated this approach, finding that the advantages include increased reliability and confirmation of visual field defects at the initial visit. By conducting 2 fields at the same visit, a clear baseline can be obtained, against which future progression can be measured. It can also help to determine whether visual field defects are repeatable, as repeatability can assist clinicians in making a more confident diagnosis.
-
24-2C Testing Grid
24-2C visual field testing grid utilises the SITA-Faster algorithm in combination with an additional 10 points incorporated centrally into the 24-2 grid. These 10 central points were selected as they are areas commonly affected by glaucoma and they are asymmetrical between the superior and inferior hemifields.
Glaucoma may affect the central and paracentral visual filed in some patients and the 24-2C was developed to avoid the need to conduct both a 24-2 and 10-2 test at the same visit.
A 2020 publication by Phu et al. showed that the additional 10 points increased the testing time by approximately 30 seconds. The authors also showed that global indices and cluster criterion showed no significant difference between a 24-2 and a 24-2C visual field, nor was there an apparent difference between the tests in their ability to detect or stage glaucoma.
Links to full text
Phu and Kalloniatis (2021) - Seeding Point Error Assessment
Phu and Kalloniatis (2021) - Frontloading Fields Study
Phu and Kalloniatis (2020) - 24-2 and 24-2C and central field defects
Phu et al. (2019) - Comparison SITA-Faster and SITA-Standard
References
Sullivan-Mee M. Karin Tran MT. Pensyl D. Tsan G. Katiyar S. Prevalence, Features, and Severity of Glaucomatous Visual Field Loss Measured With the 10-2 Achromatic Threshold Visual Field Test. Am J Ophthalmol. 2016 Aug;168:40-51.
Phu, J. Kalloniatis, M. (2021) A Strategy for Seeding Point Error Assessment for Retesting (SPEAR) in Perimetry Applied to Normal Subjects, Glaucoma Suspects, and Patients With Glaucoma. American Journal of Ophthalmology, Volume 221, 115 - 130
Phu J, Kalloniatis M. (2021) Viability of Performing Multiple 24-2 Visual Field Examinations at the Same Clinical Visit: The Frontloading Fields Study (FFS). Am J Ophthalmol. 2021 May 2;230:48-59.
Phu J, Kalloniatis M. (2020) Ability of 24-2C and 24-2 Grids to Identify Central Visual Field Defects and Structure-Function Concordance in Glaucoma and Suspects. Am J Ophthalmol. 2020 Nov;219:317-331.
Phu, J. Kalloniatis, M. (2019) Clinical Evaluation of Swedish Interactive Thresholding Algorithm–Faster Compared With Swedish Interactive Thresholding Algorithm–Standard in Normal Subjects, Glaucoma Suspects, and Patients With Glaucoma. American Journal of Ophthalmology, Volume 208, 251 - 264