
Overview
Geographic atrophy (GA) is defined by the presence of well demarcated areas of complete atrophy of the outer retina, RPE and choriocapillaris of at least 250 µm in diameter. It typically starts in the perifoveal area and can expand to involve the fovea. The presentation of atrophy can be either a singular (unifocal) or multiple (multifocal).
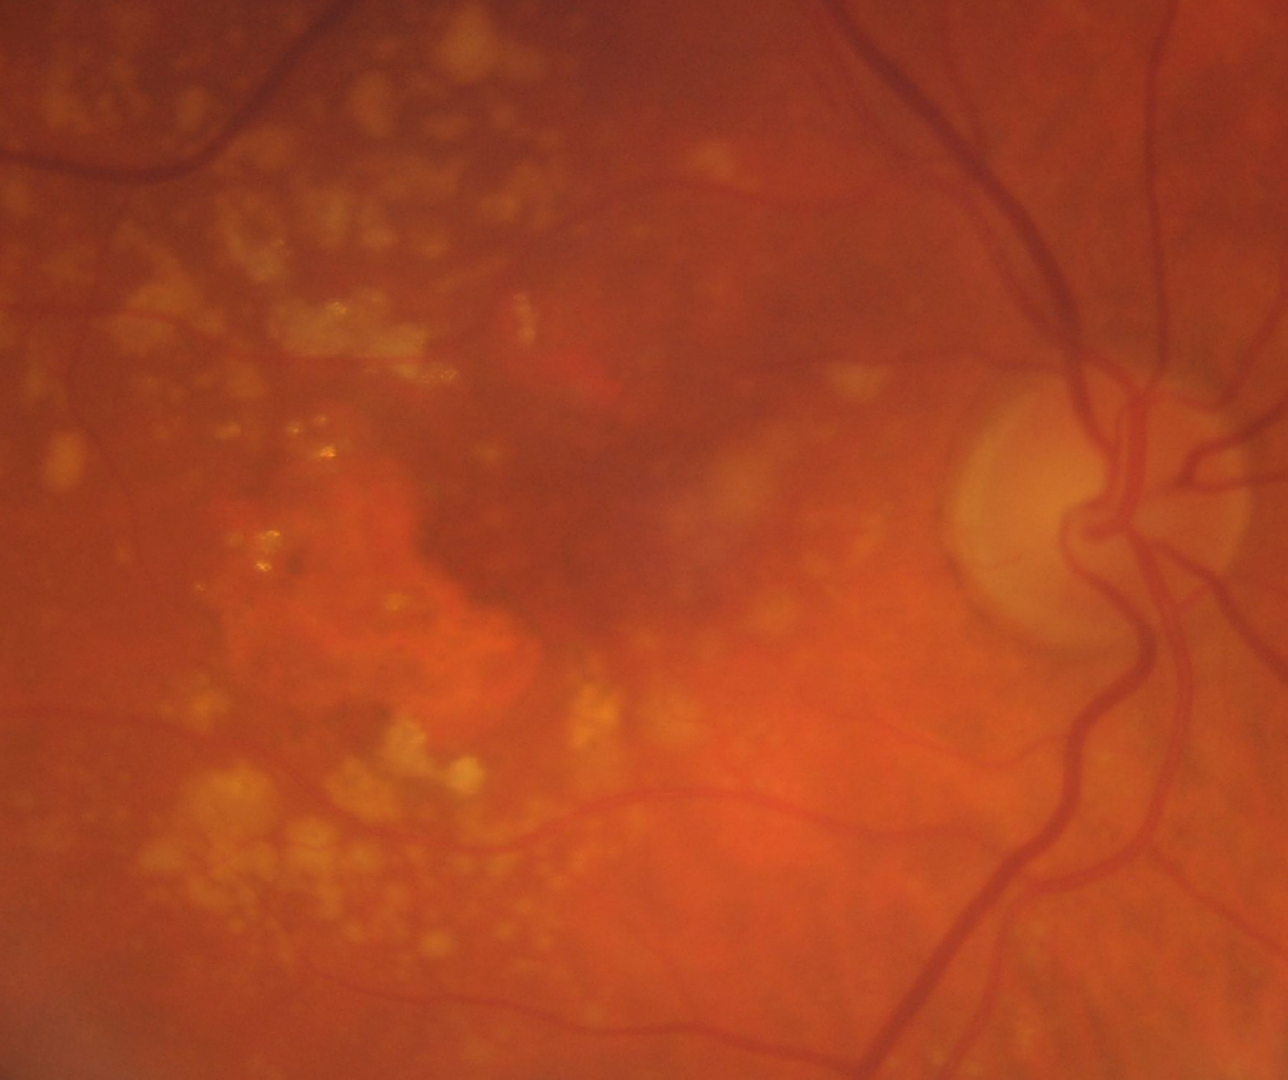
Colour fundus photography typically shows sharply demarcated areas of hypopigmentation with visibility of the underlying choroidal vessels. However, the borders of GA can be difficult to determine on fundus photography.
Fundus autofluorescence (FAF) is the predominant imaging modality in detecting GA as well as assessing for progression. The atrophic region displays a distinct dark area with a lack of fluorescent signal and can help quantify the size of atrophy. Besides this, FAF can provide information on expected progression by the presence of hyperautofluorescence at the border. It is typical to see atrophy in these hyperautofluorescent areas and signals GA progression.
OCT Definition
The advent of OCT imaging and the additional information it can provide has brought about new terminology to describe atrophy in the context of AMD. An international consensus was reached and published in Ophthalmology (Sadda et al. 2018). The key points follow:
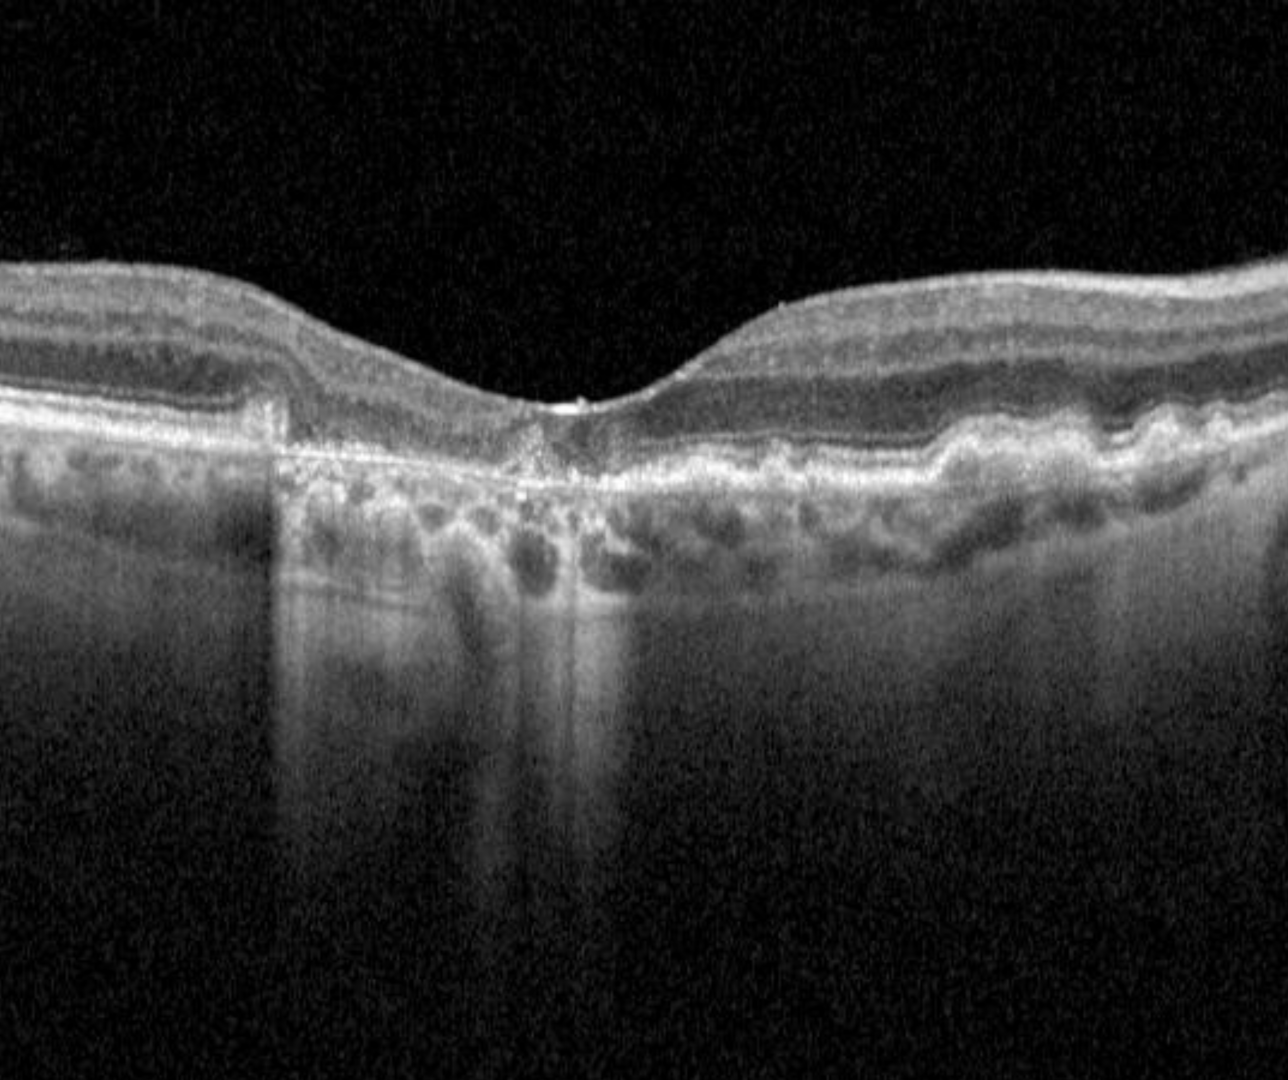
Complete outer retina and RPE atrophy (cRORA) is a term used to describe the following OCT findings (in the context of AMD):
1. A region of hypertransmission of at least 250 mm in diameter
2. A zone of attenuation or disruption of the RPE of at least 250 mm in diameter and
3. Evidence of overlying photoreceptor degeneration (this includes any of the following: loss of the interdigitation zone, ellipsoid zone, and external limiting membrane and thinning of the outer nuclear layer).
There are several structural changes able to be seen on OCT that may confer an increased risk of progression from intermediate AMD to geographic atrophy. Further information about these may be found on the link at the bottom of the page "Intermediate AMD: Prognostic Biomarkers".
Case examples
-
Case 1
A 74 year old Caucasian female with best corrected visual acuity of 6/15- (20/50-) in the right eye.
-
Case 2
A 78 year old Caucasian female. Visual acuity is 6/9.5 (20/32) in the right eye and 6/12 (20/40) in the left.
Fundus photo(1), red free (2) and fundus autofluorescence (3) images - right eye
More infoSpectralis OCT volume (1) and line scan (2) - right macula
More infoFundus photo(1), red free (2) and fundus autofluorescence (3) images - left eye
More infoSpectralis OCT volume (1) and line (2) scans - left macula
More info -
Case 3
An 83 year old Caucasian female with visual acuities of 6/9.5- (20/32-) in the right eye and 6/12 (20/40) in the left.
Fundus photo(1), red free (2) and fundus autofluorescence (3) images - right eye
More infoSpectralis OCT volume (1) and line (2) scans - right macula
More infoFundus photo(1), red free (2) and fundus autofluorescence (3) images - left
More infoSpectralis OCT volume (1) and line (2) scans - left macula
More info -
Case 4
An 80 year old Caucasian female presented with best corrected acuity of 6/9.5 (20/32) in the right eye. At the 2 year follow up, visual acuity had reduced to 6/18- (20/60-).
GA Progression
-
Overview
Geographic atrophy lesions typically form in the perifoveal region initially, slowly enlarging to involve the fovea over time. The rate of growth of lesions can vary significantly with a range of 0.53 to 2.6 mm2/year reported in the literature.
This difference in growth rates has led to the hypothesis that different phenotypes of GA, associated with different progression rates, exist.
This is still an emerging area of research, however some biomarkers that may potentially indicate faster progression of GA have started to emerge. This section will take a brief look at this emerging area.
-
Hyper-FAF patterns
One of the key biomarkers emerging in this area is the extent and distribution of the hyper-FAF pattern. The images show various patterns of hyper-FAF that have been identified.
Lesions with banded and diffuse hyper-FAF patterns surrounding the lesions of GA show higher rates of progression compared to most other patterns shown (none, focal or a patchy FAF pattern). The diffuse tracking pattern has been identified to have the highest and most rapid progression rate however. This pattern is characterised by a greyish. lobular appearance on FAF imaging.
-
Other potential biomarkers
Other potential biomarkers that could indicated a faster progression of geographic atrophy include:
1. Larger GA lesions at baseline - it is variable between studies, but generally speaking a "large" GA lesion is greater than 1 disc diameter.
2. Extrafoveal (rather than foveal) lesions
3. Multifocal (rather than unifocal) lesions
4. The presence of reticular pseudodrusen
5. GA lesions in the fellow eye
6. Ellipsoid zone (EZ) disruption surrounding the area of GA (OCT biomarker)As mentioned, this is an emerging area of research and these biomarkers could well evolve or even be discredited in the future as the evidence-base evolves.
Differential diagnosis
References
Bui PTA, Reiter GS, Fabianska M, Waldstein SM, Grechenig C, Bogunovic H, et al. Fundus autofluorescence and optical coherence tomography biomarkers associated with the progression of geographic atrophy secondary to age-related macular degeneration. Eye (Lond). 2022;36(10):2013-9.
Ferris, CP. Wilkinson, AB, Chakravarthy, U. Chew, E. Csaky, K. Sadda, SR. (2013) Clinical Classification of Age-related Macular Degeneration, Ophthalmology, Volume 120, Issue 4, Pages 844-851.
Sadda SR, Guymer R, Holz FG, Schmitz-Valckenberg S, et al. (2018) Consensus Definition for Atrophy Associated with Age-Related Macular Degeneration on OCT: Classification of Atrophy Report 3. Ophthalmology. 125(4):537-548.
Schmitz-Valckenberg S, Sahel JA, Danis R, Fleckenstein M, Jaffe GJ, Wolf S, et al. Natural History of Geographic Atrophy Progression Secondary to Age-Related Macular Degeneration (Geographic Atrophy Progression Study). Ophthalmology. 2016;123(2):361-8.